Robust Detection and Modeling of the Major Temporal Arcade in Retinal Fundus Images
The major temporal arcade (MTA) is the thickest vessel in the retina, and it is used as an indicator of the severity of different ocular pathology. In the present work, a novel method for the automatic detection and numerical modeling of the MTA is presented. The method uses a quadratic-spline approximation with a weighted RANSAC scheme, which estimates a MTA Probability Map based on both a Distance Transform-based vessel thickness image and a foreground location map. The performance of the proposed method is evaluated with respect to different methods of the state of the art in terms of vessel detection, vessel skeleton detection, and closeness between the numerical modeling and the ground-truth delineation of the MTA using five different metrics. On the other hand, to perform the computational experiments, the DRIVE database of retinal fundus images has been adopted, where the manual delineations of the MTA have been performed by an expert ophthalmologist. The computational results, indicate that the automatic MTA detection and numerical modeling achieved by the proposed method outperforms existing approaches with a balanced Accuracy of $0.7067$, Mean Distance to Closest Point of $7.40$ pixels, and Hausdorff Distance of $27.96$ pixels, while demonstrating competitive results in terms of execution time ($9.93$ seconds per image). In addition to the experimental results, and based on the trade-off between modeling accuracy and execution time, the proposed method is suitable to be used in systems that perform computer-aided diagnosis in clinical practice and for the timely treatment of different eye diseases.
The present ground-truth database represents the first set of images in the literature that includes the specific manual delineations of the MTA made accessible to the scientific community for research and comparison purposes.
Authors:
Dora E. Alvarado-Carrillo, Ivan Cruz-Aceves*, Martha A. Hernández-González, and Luis M. López-MonteroResearch paper submitted to the Journal: Mathematics, MDPI, Special Issue: Classification, Diagnosis and Prognosis of Diseases Using Machine Learning Algorithms
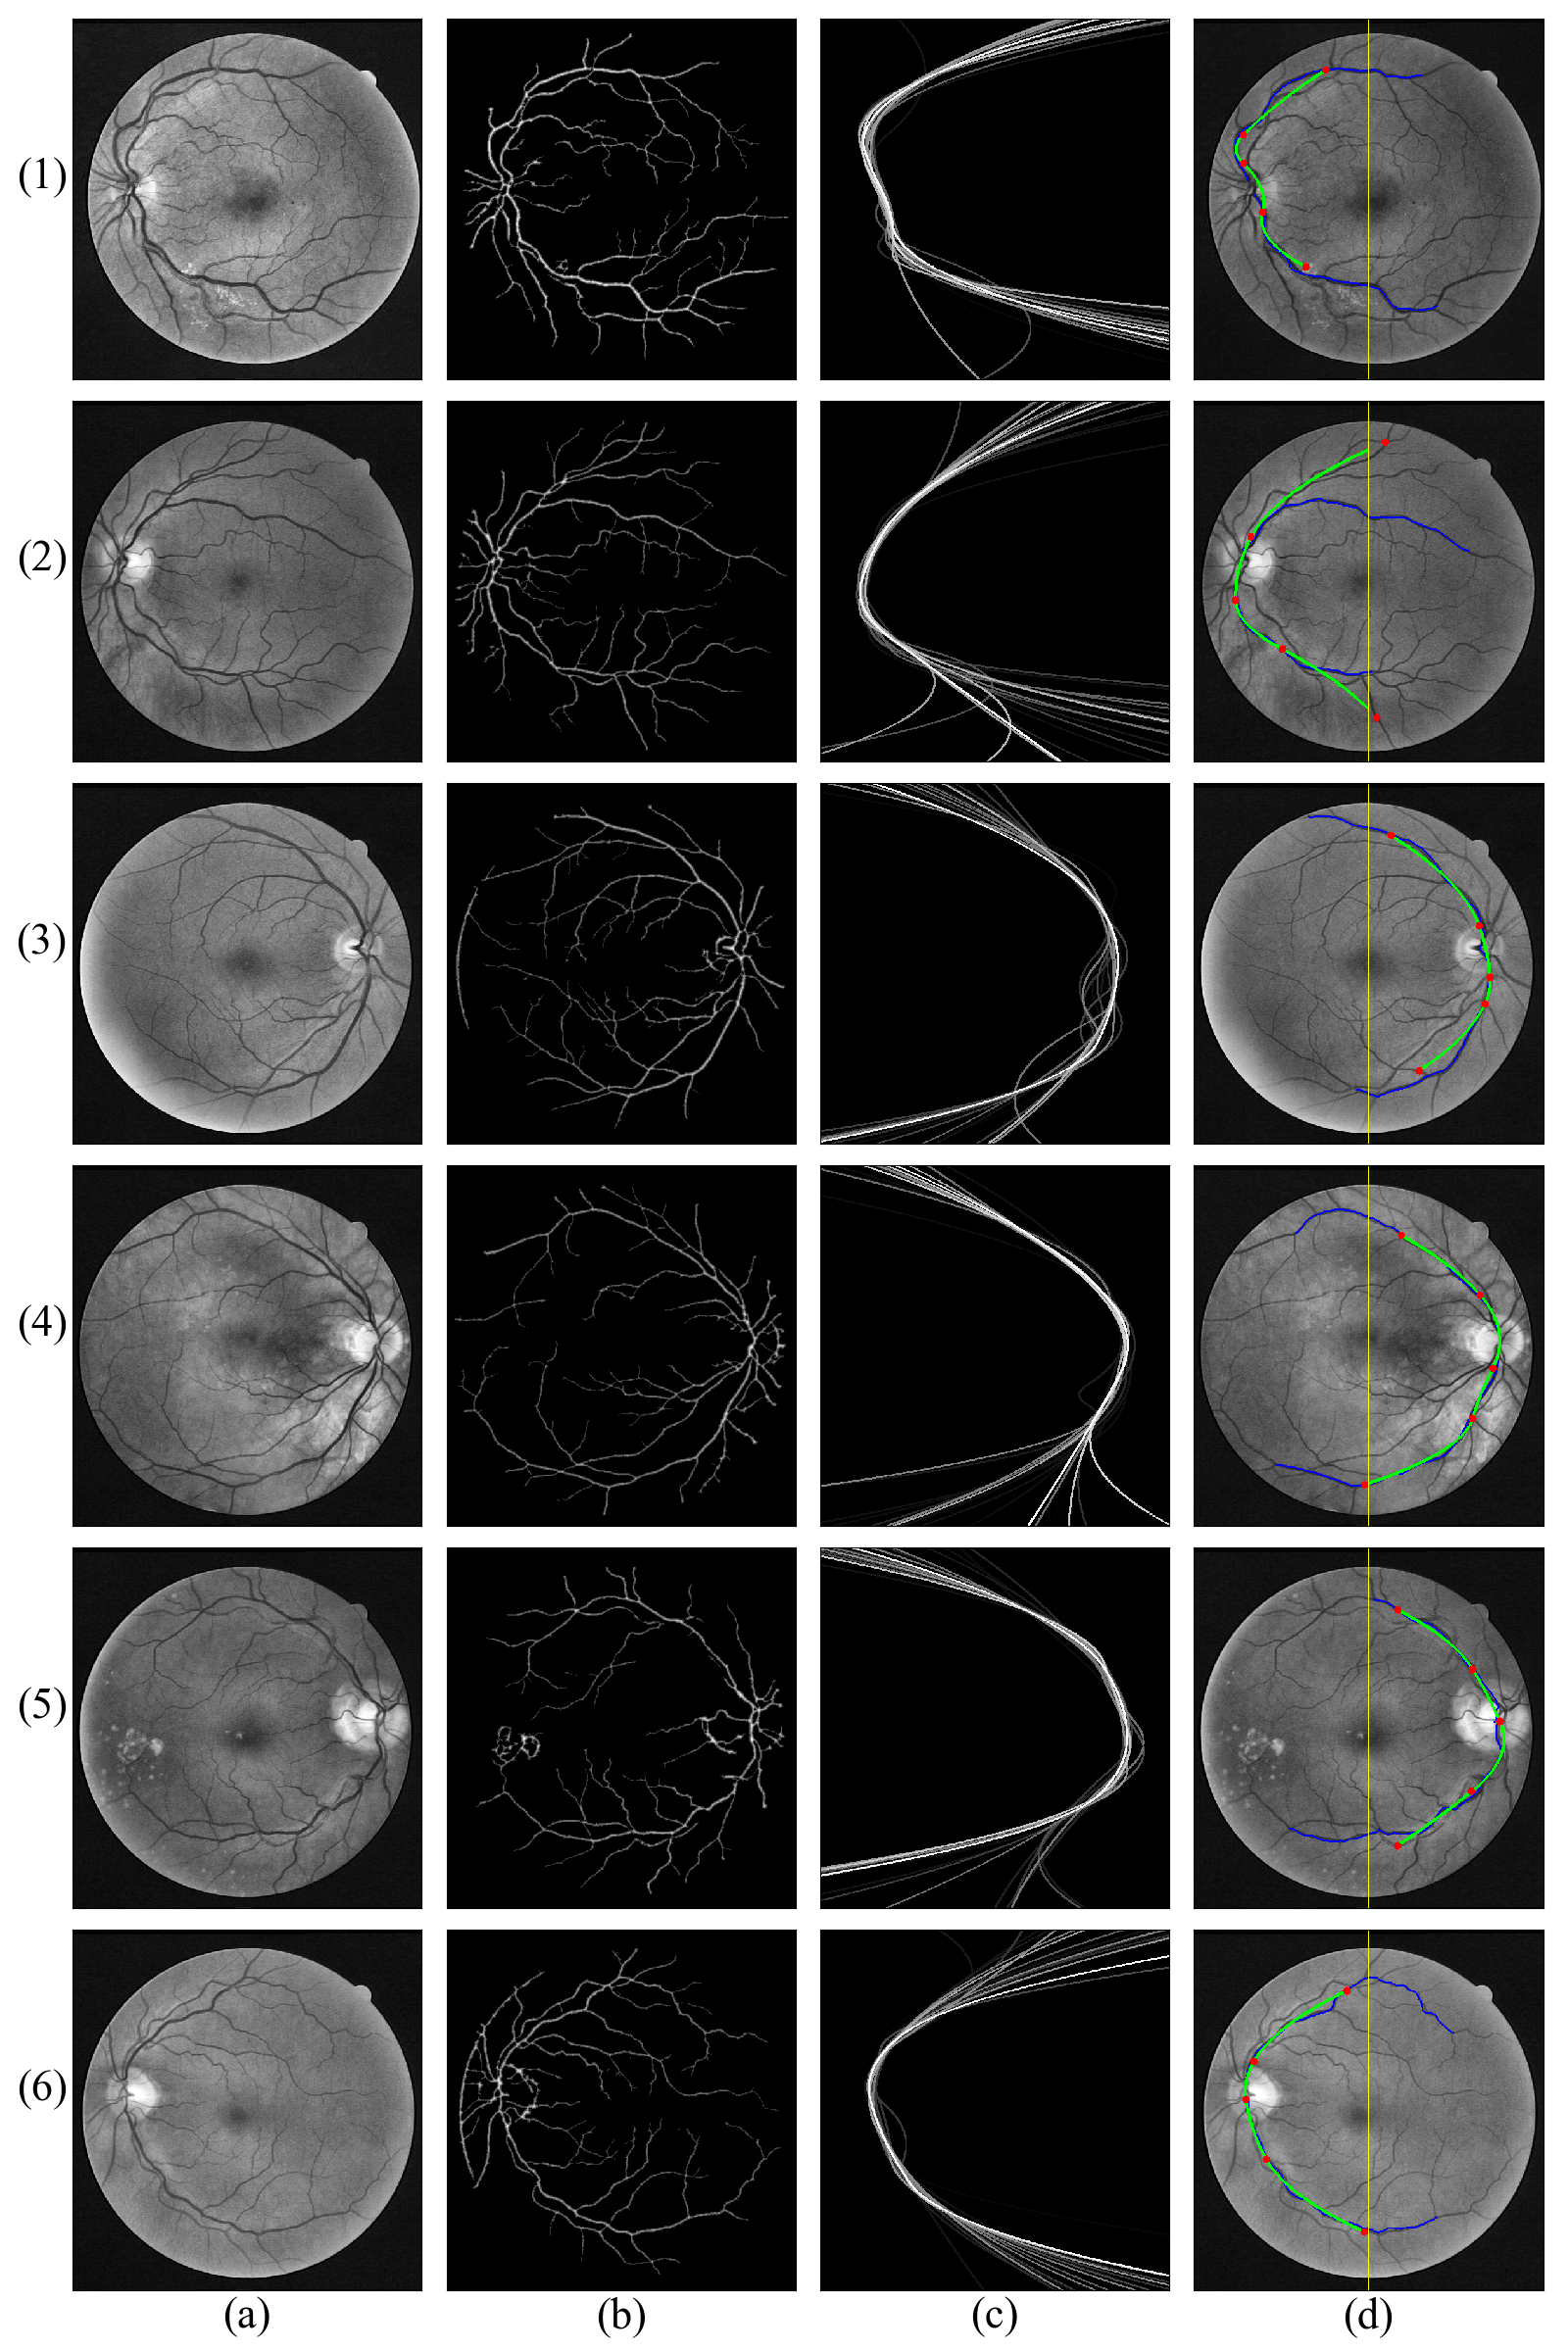
Experimental results
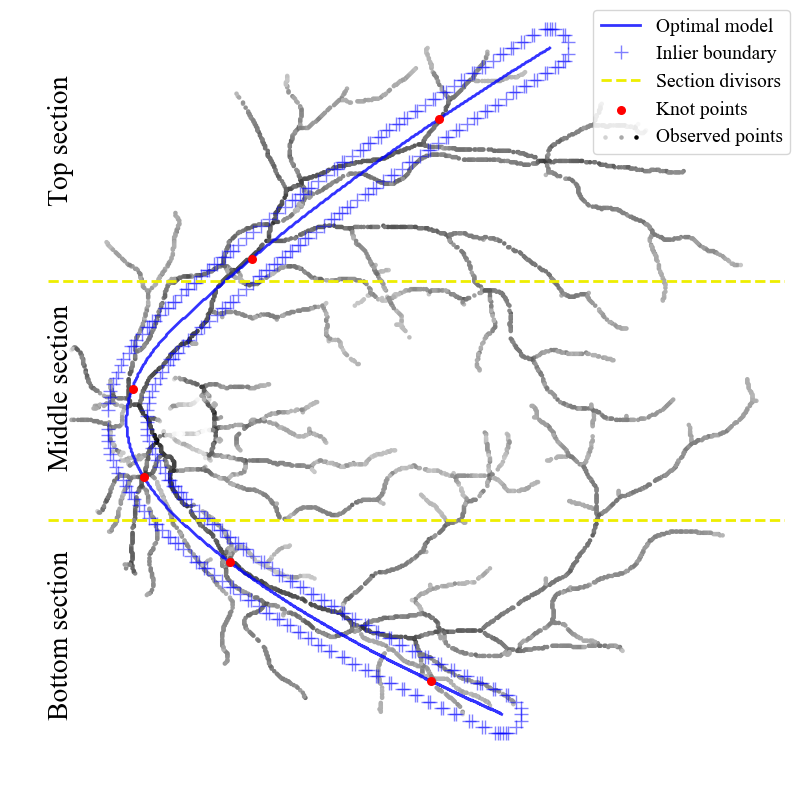
The weighted RANSAC method for modeling the MTA.
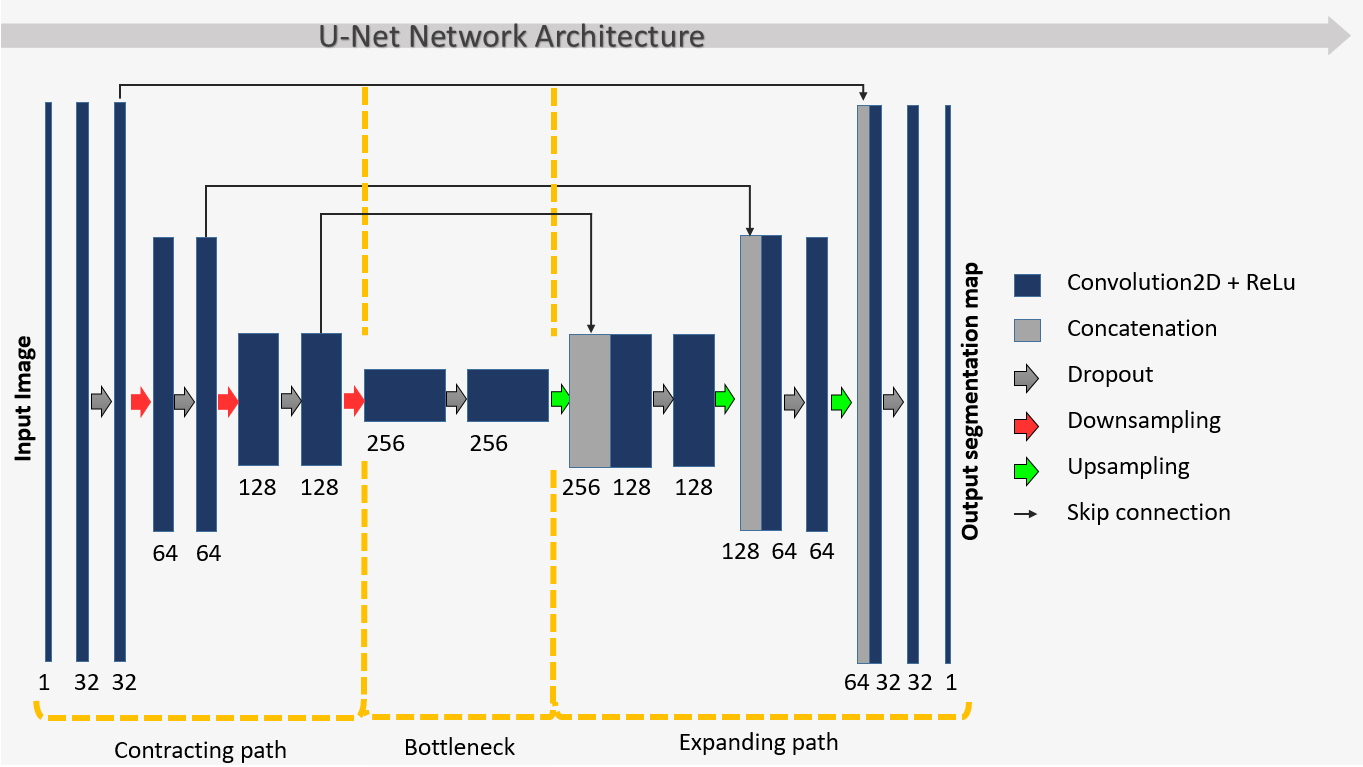
The U-Net Architecture. This design is used to solve the blood vessel segmentation problem in retinal images.
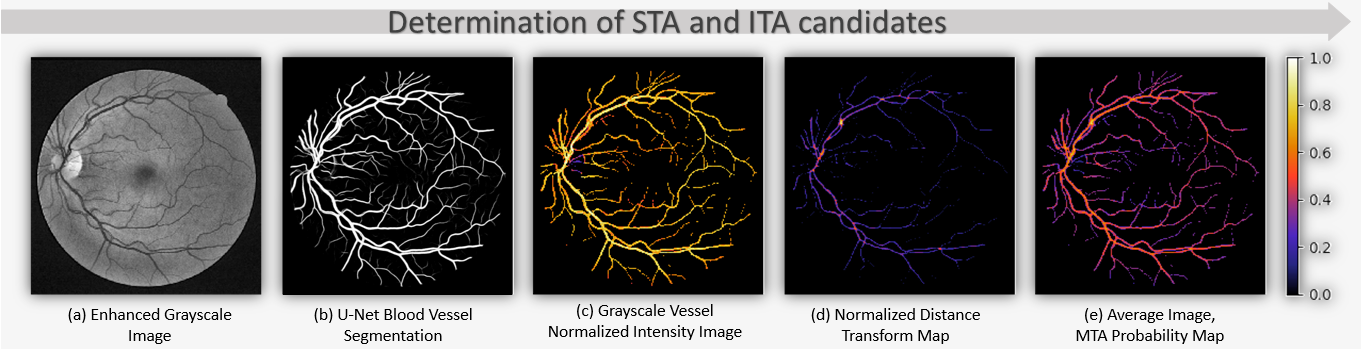
Determination of the STA and ITA. The process includes three steps: 1. Using the Enhanced Grayscale Image (a) and the Blood Vessel Segmentation (b) to obtain the grayscale intensities of the blood vessels (c); 2. Using the Blood Vessel Segmentation (b) to compute the Normalized Distance Transform Image (d); 3. Averaging images (c) and (d) to obtain the MTA Probability Map (e).