
| II. Starting | IV. |
Part III. Using BioP
This section explains in detail how to work with BioP.
III.1 Menu bar
This bar contains all functions and tasks possible within BioP, from entering or exporting the archives, running the calculations, to changing the working language (at the moment only Spanish and English are supported). In case of working with a keyboard only, it is recommended to work through this menu bar.
In the next section we will explain the buttons, bars and windows of BioP, and the steps needed to realize a prediction.
III.2 Preparing the files.
Start with explaining the necessary size/resolution limits of the archives. How make archives.. ascii and text.. ArcView
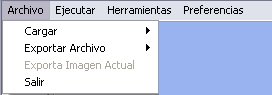
- File. Contains the options to lead the archives needed to arrive at a prediction, to export the results (predictive probability, certainty of prediction, prior potential) in several formats (.txt, .asc, .xls), and to export the image shown in the map zone.
- Execute.Executes the calculations, when all needed archives are loaded. One or all of the loaded archives can be deleted, in order to load a modified archives.
- Tools. These tools allow one to prepare archives to be read into BioP.
- Preferences. Here you find options to change the graphic environment of BioP.
III.2.1. Tool bar.

This bar has the most important BioP tasks. When active, the buttons are in colour, while
when de-activated (archive already loaded), they are grey. The following options are given:
Load area.
 Loads the covariables archive. By
default the first covariable in the archive is shown in the map, with the assigned categorization. The list of
covariables is shown in the explorer.
Loads the covariables archive. By
default the first covariable in the archive is shown in the map, with the assigned categorization. The list of
covariables is shown in the explorer.
 Load the bias archives. This archive
can either be a calculated one (one that has been constructed before in the Bias Administrator), or a uniform
(non-informative) one.
Load the bias archives. This archive
can either be a calculated one (one that has been constructed before in the Bias Administrator), or a uniform
(non-informative) one.
 Loads the a priori archive,
being either a specific one (made through the Prior Administrator), or a non-informative, uniform one.
Loads the a priori archive,
being either a specific one (made through the Prior Administrator), or a non-informative, uniform one.
 Load the archives with the observed
points of presence. These will be shown in the map as green points. When multiple species apppear in the list,
the points will have distinct shades of green. The species is/are also shown in the explorer.
Load the archives with the observed
points of presence. These will be shown in the map as green points. When multiple species apppear in the list,
the points will have distinct shades of green. The species is/are also shown in the explorer.
Execute area.
 Delete all loaded archives. For
running an entirely new prediction.
Delete all loaded archives. For
running an entirely new prediction.
 Delete the selected archive, in order
to load an alternative one.
Delete the selected archive, in order
to load an alternative one.
 Execute the calculation. This option
will be shown activated onca all needed archives have been loaded.
Execute the calculation. This option
will be shown activated onca all needed archives have been loaded.
Results area.
 Show the map of predictive probabilities.
 Show the map of the prediction uncertainties.
 Show the map of the prior potential.
III.1.3. Map area.
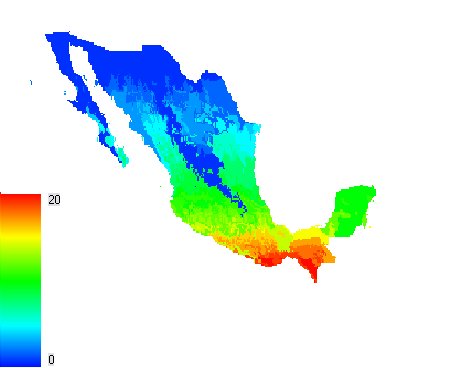
Here the loaded maps are shown, as well as the maps resulting from the ecological modelling
calculations. To change maps, use the explorer to the right (double click on the desired variable).

Here also the the colour legend is shown, with the minimum and maximum values of the map.
III.1.4. Explorer.
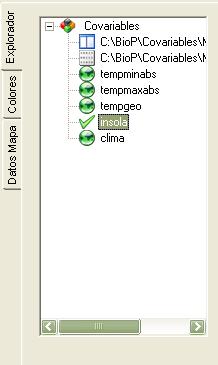
This part of the main screen is composed of three sub-windows. The first one contains the
map and data explorer, and permits one to check the contents of the loaded archives. The icons represent the
following options:
 Represents which data are currently
selected.
Represents which data are currently
selected.
- Represents the maps which can be shown
through double clicking on the icon.
 Represents the archives which have been
loaded outside the application. Double click to open using Windows Notepad.
Represents the archives which have been
loaded outside the application. Double click to open using Windows Notepad.
 Represents the data of the archive in
question. Double click to enter.
Represents the data of the archive in
question. Double click to enter.
III.1.5. Map colours.
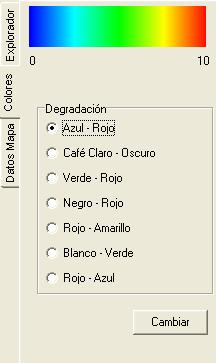
Here the colours of the current map can be manipulated. Select the appropriate map, change
to the map colour window, select one of the colour schemes, and press "change".
III.1.6. Map data.
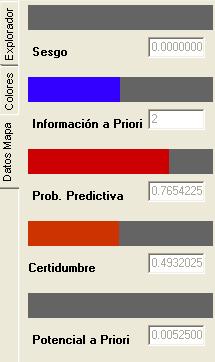
This window shows the values of the data which represent the present map. When the mouse is moved over the map, the values of the points under the mouse are shown.
III.1.7. Log window.
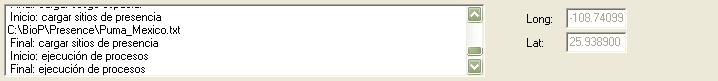
This part of the main screen shows every actions which takes place within the application, from loading the archives to error messages. Next to this window are displayed the geographical coordinates of the mouse when positioned over the map.
III.2. Covariates administrator
This tool is dedictated to construct the covariable file (the text file which describes all covariate values within the area). We will show the tool's window and explain every component:

III.2.1. Menu bar.

This bar contains all tasks for the covariable administrator, from creating new projects to modifying existing ones:
- Archive.Contains the options of loading archives, create new projects, and open existing projects.
III.2.2. Tool bar.

This bar contains common tasks within the covariable administrator:
 Load a folder which contains
several ascii files.
Load a folder which contains
several ascii files.
 Load a single ascii archive.
 Clean the selection zone. In case of
wanting to create a new covariable archive.
Clean the selection zone. In case of
wanting to create a new covariable archive.
 Save the selection of covariables, so
that they are ready to be loaded in the main screen.
Save the selection of covariables, so
that they are ready to be loaded in the main screen.
- Automatically load the present
selection into the main screen.
 Close the covariable administrator.
III.2.3. Selection area.
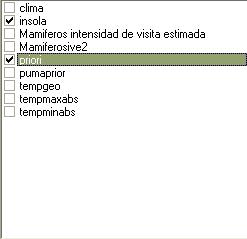
In this zone the loaded ascii archives are shown. The boxes show which covariables have been selected. The name and the number of categories of the active covariable is shown.
III.2.4. Data area.
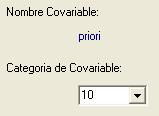
This small area shows the name of the covariable and its categorization. In case a covariable
from a ready-made project has been loaded, the number of categories cannot be changed anymore; only with newly
selected covariables can the number of categories be modified. The default number of categories is 10.
NB in a future version this will be more sophisticated and automated.
III.2.5. Action buttons.
These are two buttons which can be used to change which covariables are selected. The Select All button selecchecks all the boxes of the covariables, while the button Deselect All "de-checks" all the boxes of the covariables.
| II. Starting | IV. |