Research
My research interest is in Image Processing and Computer Vision. Specifically, my intention is to excavate computationally viable solutions to large scale (complex) and completely automated image analysis and vision applications that require any of these techniques: image segmentation/classification and object detection/tracking using machine learning. In the following, I select three topics which are thoroughly investigated in my research.
Hierarchical Level Set With AR-Boost: An Automated Multilevel Image Segmentation and Its Application to White Matter Lesion segmentation
Abstract: Hierarchical as well as coupled level sets are widely used for multilevel image segmentation. However, these tools are successful if the number of levels of an image are known and a careful choice of initialization is performed. We intend a novel hierarchical level set (HLS) followed by an Adaptive Regularized Boosting (AR-Boost) for automatic White Matter Lesion (WML) segmentation from Magnetic Resonance Images (MRI). HLS does not need to know the number of levels in an image and HLS is computationally less expensive and more initialization independent than coupled level-sets since HLS doesn’t generate redundant regions. We employ an energy functional that minimizes the negative logarithm of variances between the two partitions created by the level set function. HLS uses a level set to partition the image into a number of segments, then applies the level set on all the segments separately to create more segments and the process continues iteratively until all the segments become a nearly homogeneous region (low intensity variance). Then AR-Boost is applied which classifies the segments into WML and non-WML classes. The proposed loss function for AR-boost enforces more weight on misclassified samples at each iteration than Adaboost to classify correctly in the next iteration and consequently leads to early convergence. Unlike Adaboost, the user can select optimal weights through cross-validation. Experimental results demonstrate that the proposed method outperforms state-of-the-art automated white matter lesion segmentation techniques.
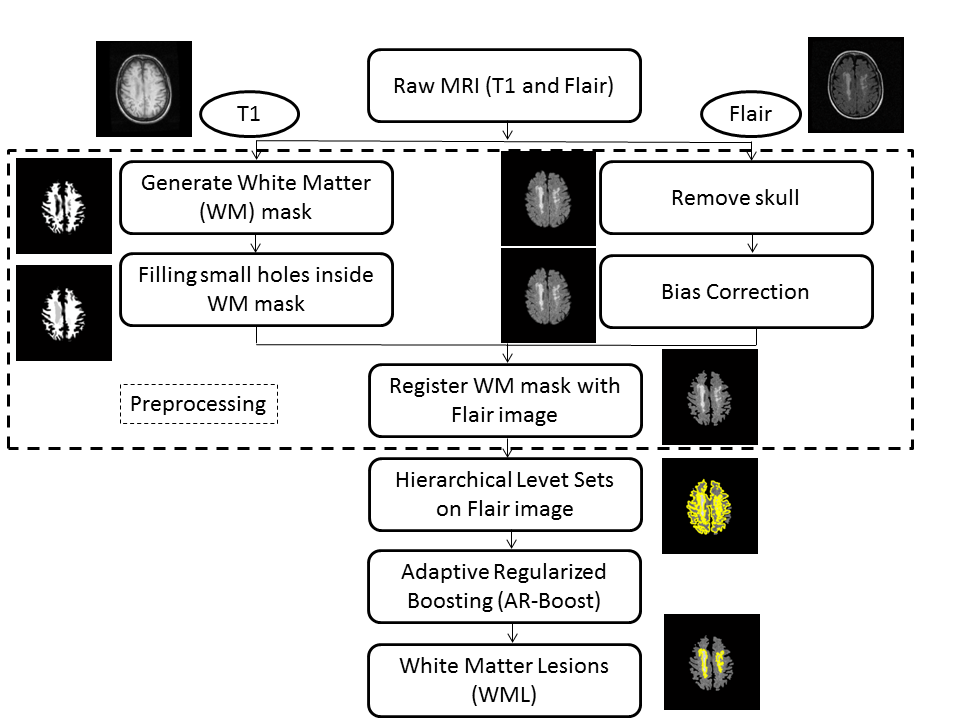
Proposed Method: The proposed methodology is depicted in Figure 1. The input of the algorithm is three-dimensional structural T1 and Flair sequences of the patient's MRI and the output is the white matter lesions found on Flair sequences. We first preprocess the data where we generate white matter (WM) mask from T1 images. Then we register WM mask with skull stripped and bias corrected Flair images and retain only the region from the Flair images that lie inside WM mask.Subsequently we apply HLS which returns a set of regions including both lesions (desired object) and non-lesions. Then AR-Boost classifies the regions into lesions and non-lesions.
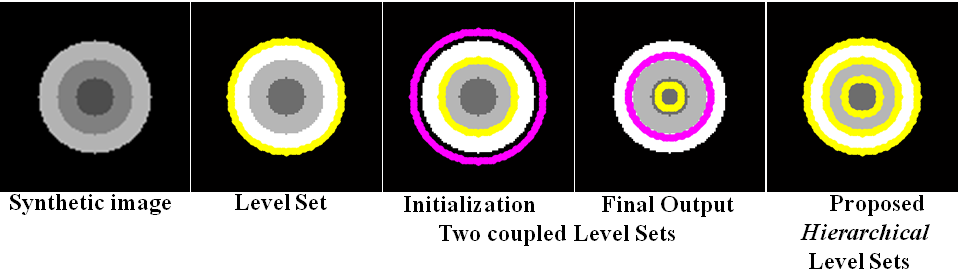
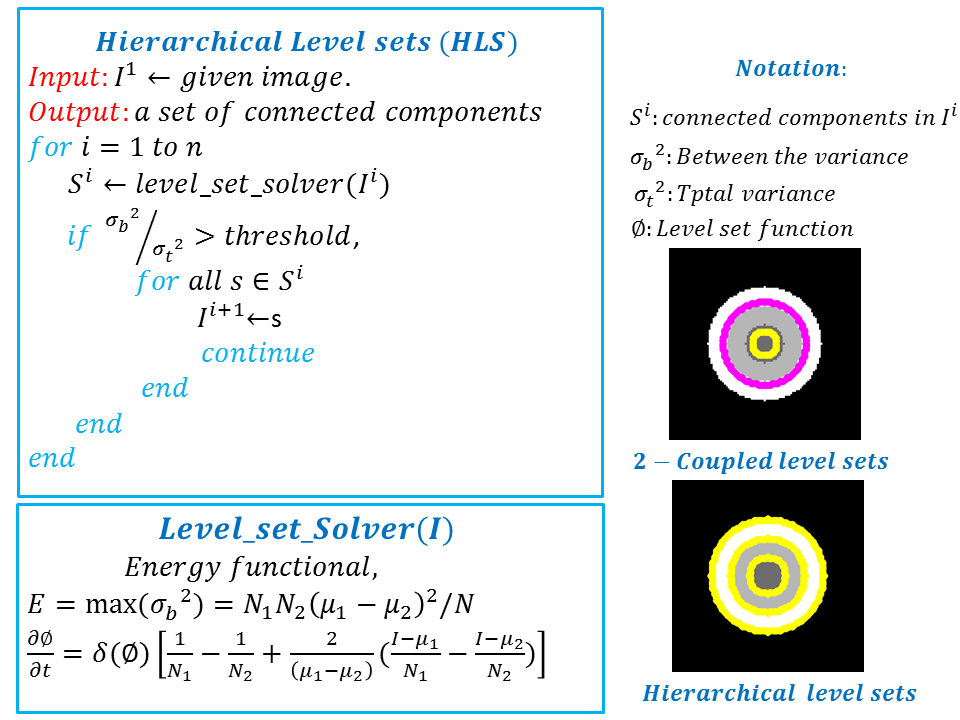
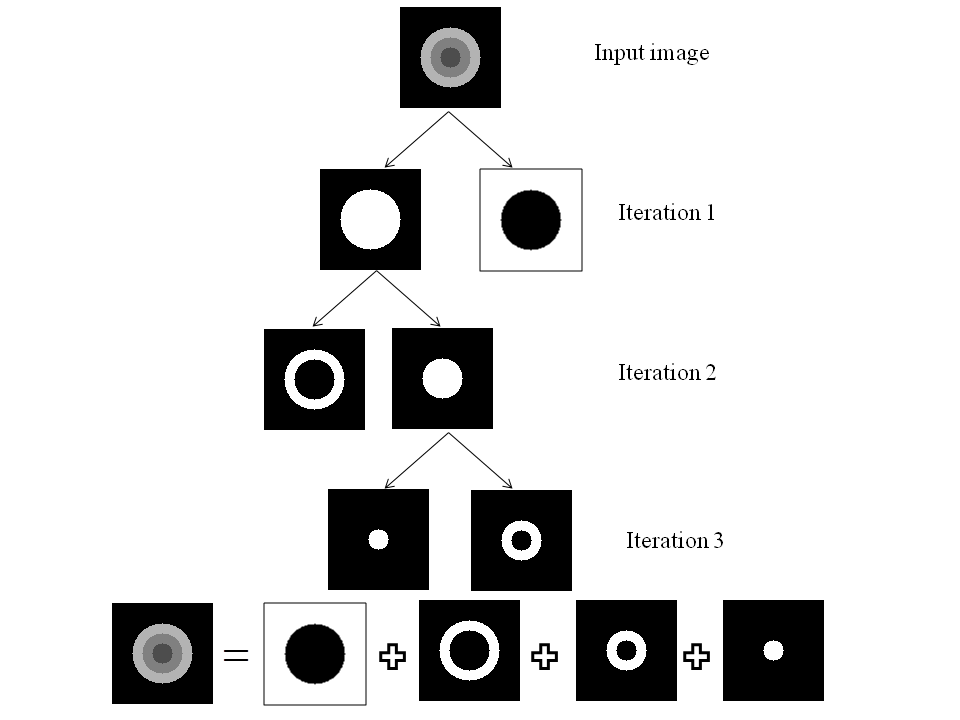
Hierarchical Level Set Method: Typically level set creates 2 partitions. For more partitions, coupled level sets are used. n-level set creates 2 n number of partitions. However, the success of level set depends on its initialization. Hierarchical level sets implement level set in a hierarchical fashion. In HLS, we apply level set that creates 2 partitions. Then we compute the ratio of "between variance" and "total variance" of 2 partitions and if the ratio is greater than the threshold, then we apply level set in each of the region separately and create 2 partitions on each region. This procedure continues until the the ratio of "between variance" and "total variance" of 2 candidate partitions is below a threshold value. Figure 2 shows the results of level set, 2-coupled level sets and hierarchical level sets. Figure 3 depicts the hierarchical level set algorithm. Figure 3 shows the HLS and Figure 4 shows the results of HLS on a synthetic image.
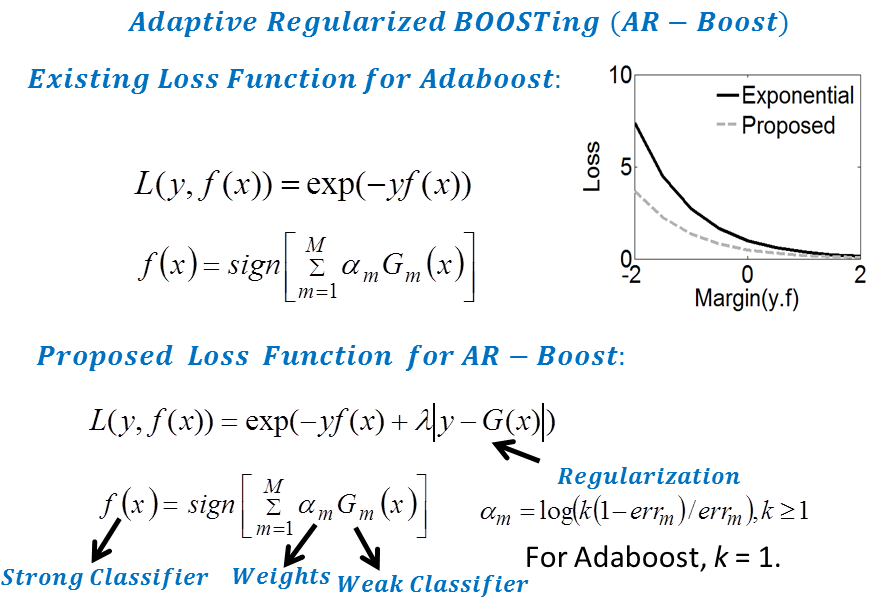
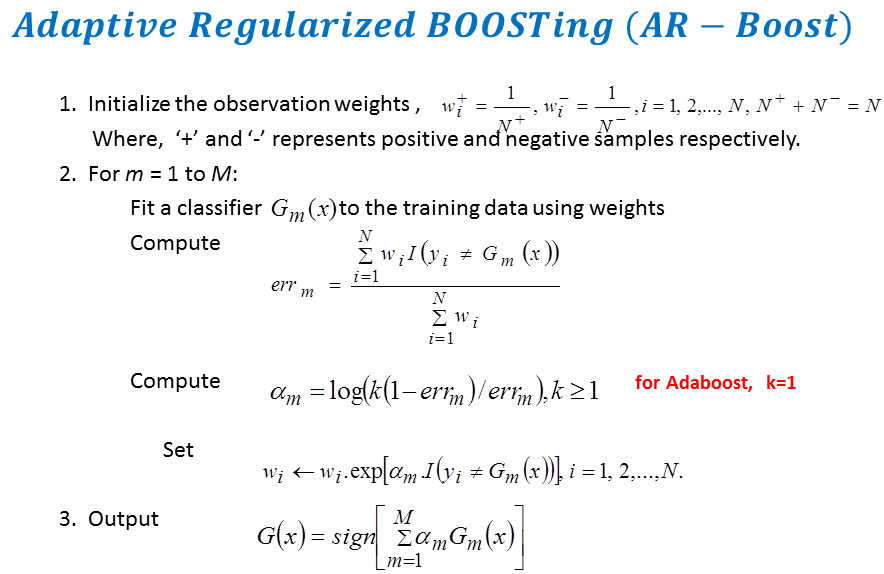
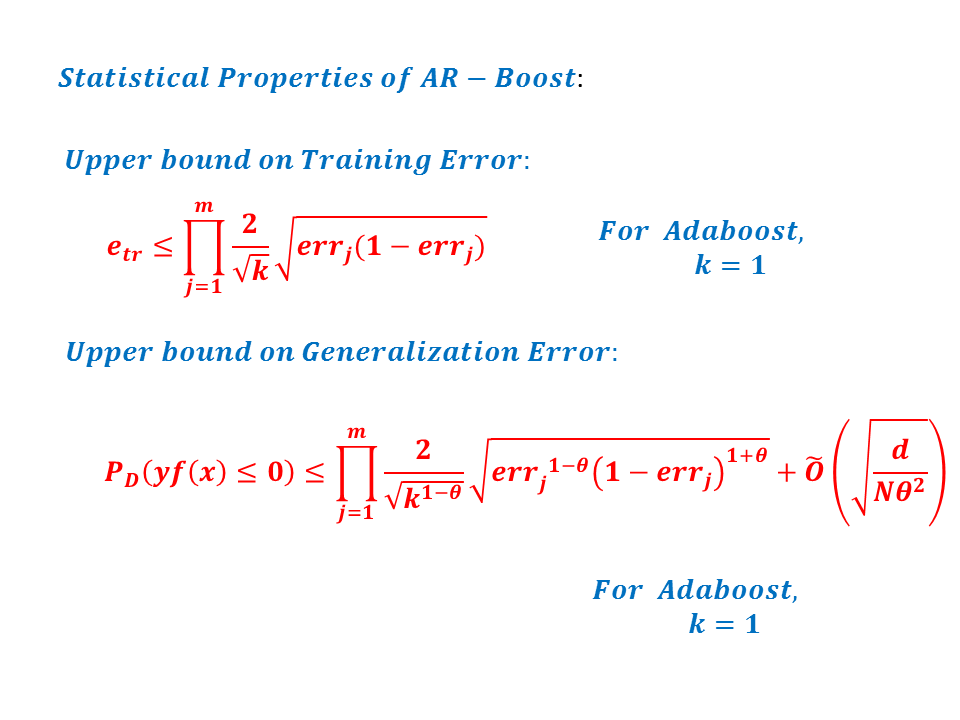
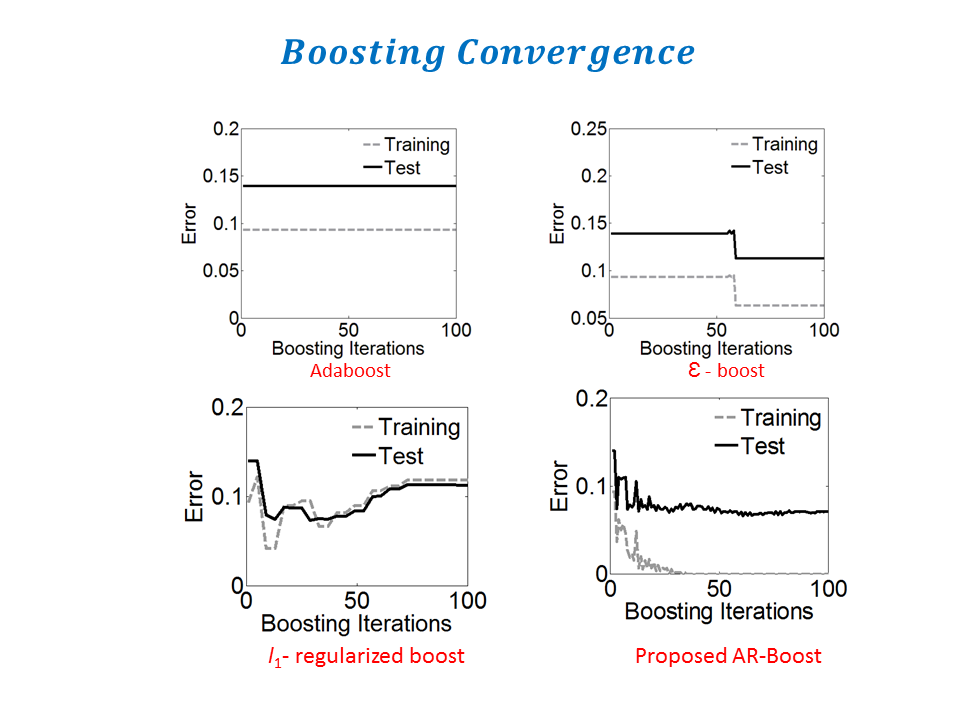
Adaptive Regularized Boosting: Adaptive Regularized Boosting incorporates a regularization term in the exponential loss function for boosting that awards less penalty than than Adaboost for negative margin as shown in Figure 5. Proposed AR-Boost loss function is same as exponential loss function when the weak classifier at current stage classifies accurately. Otherwise, AR-Boost enforces more weights to the misclassified samples than Adaboost so that the weak classifier of the next stage provides more importance while classifying them. We minimize the proposed regularized loss function and derive a slighty different boosting algorithm than adaboost that are illustrated in Figure 6. Figure 7 shows that the upper bound of training and generalization error of AR-Boost is less than or equal to Adaboost. Figure 8 displays the convergence of different boosting algorithm. Figure 8 shows that proposed AR-Boost obeys more montonoic decreasing of training and test error with boosting iterations.
Experimental Results: Images used in this study were collected from ongoing studies investigating white matter changes in diabetes at Wake Forest . We obtained a sample of 50 randomly selected control subjects, and 50 diabetic patients. All brain images were acquired on the same 1.5 T GE scanner with twinspeed radients using a neurovascular head coil. We used a 3D structural T1-weighted sequence, and a 3D structural FLAIR sequence. Results showed that Proposed methodology performs better than state-of-the art techniques. For more informations, please read our paper:
The Evolution of Snake Toward Automation for Multiple Blob-Object Detection
Abstract: For the last two decades “active contour” or “snake” has been effective as an interactive image segmentation tool in a wide range of applications, especially for blob-object delineation. In the interactive snake segmentation process, a user draws a rough object outline; next, a cost function is optimized to drive the user-drawn contour a.k.a. snake to delineate the desired object boundary. Although successful as an interactive segmentation tool, snake exhibits poor performances in various noteworthy image segmentation applications that require complete automation. Examples include oil sand particle delineation, biological cell segmentation and so on. This research presents a novel, completely automated snake/active contour algorithm for multiple blob-object delineation. The algorithm consists of three sequential steps: (a) snake initialization: where we apply a Probabilistic Quad Tree (PQT) based approximate segmentation technique on an image to find the regions of interest (ROI) where the probability of having objects is very high and place seeds uniformly within the ROIs; (b) snake evolution: where we evolve one novel Interleave Directional Gradient Vector Flow (IDGVF) snake from each seed; (c) snake validation: where we classify the snakes into object and non-object classes using a novel adaptive regularized boosting (ARboost). Existing efforts towards snake automation have concentrated only on the succession of initialization and evolution steps and have practically overlooked the snake validation step. Here, we emphasize that we cannot skip the validation step, even though the initialization and evolution have performed well. Our proposed novel validation step, executed after complete convergence of a snake contour from a given initialization, classifies the evolved contour into desired object and non-object classes. ARboost employs a novel loss function for boosting that enables to classify snakes more accurately into object and non-object classes than other variants of boosting. PQT generates substantially fewer seed points and is therefore more efficient than other initialization methods without degrading the segmentation performance. We have demonstrated that IDGVF is more robust to initialization and it possesses a broader capture range than other variants of GVF snakes. The proposed automated snake algorithm has been successfully applied to two real data sets: oil sand ore images that have relevance in the oil sand mining industry and leukocyte images that are significant in biomedical engineering.
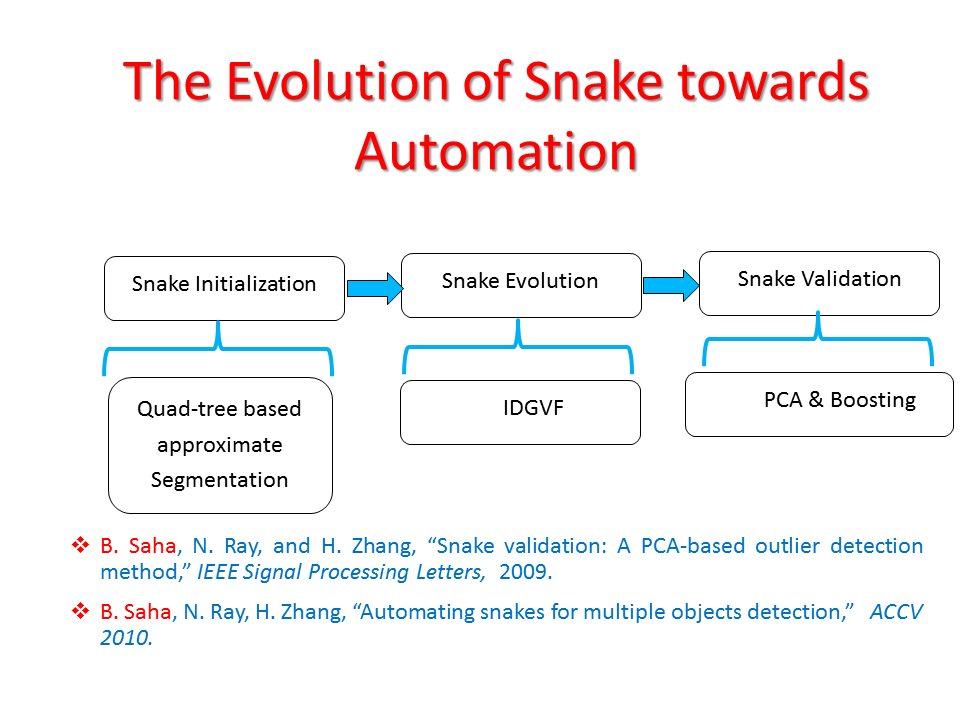
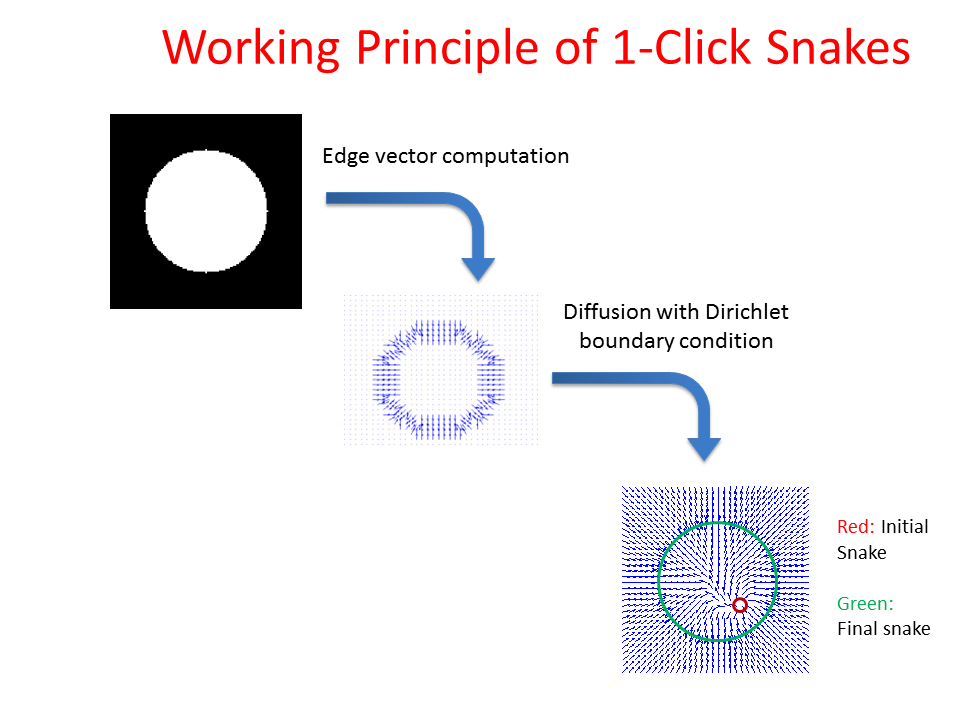
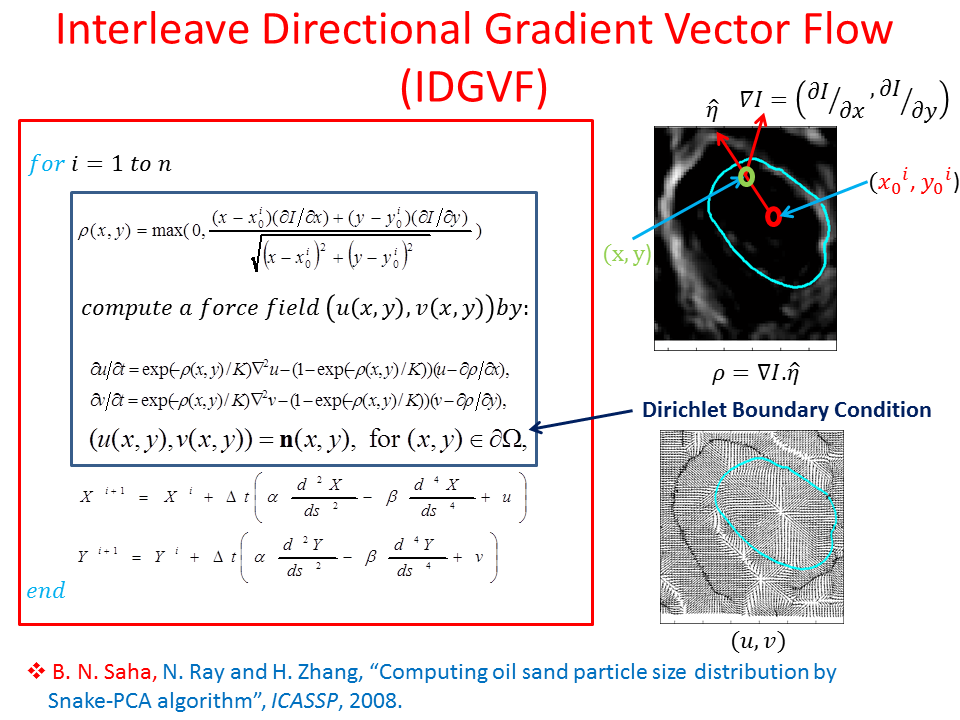
Proposed Method: Figure 9 shows that our method for snake automation consists of three steps: Snake initialization, snake evolution and snake validation. We propose a minimally interactive snake (one click snake) as shown in Figure 10 where snake can develop from a very small circle (~3 pixel radius). We introduce three additional modifications of gradient vector flow (GVF) snake to make it minimally interactive: (a) We adopt dirichlet boundary condition into snake energy functional; (b) We compute gradient vector field in an iterleave fashion: We compute gradient field and develop snake until convergence, then modify the gradient field and develop snake from the converged position of previous stage and continue this procedure until ther is no significant change found in the area delineated by the snake in the current iteration with that of previous iteration and (c) We introduce a directional term in the snake energy functional that pulls the snake towards the object edges.We call this minimally interactive snake as "Interleave Directional Gradient Vector Flow Snake" (IDGVF) and the algorithm of IDGVF is depicted in Figure 11. Proposed modification helps in snake covergence on actual object edges as shown in Figure 12.

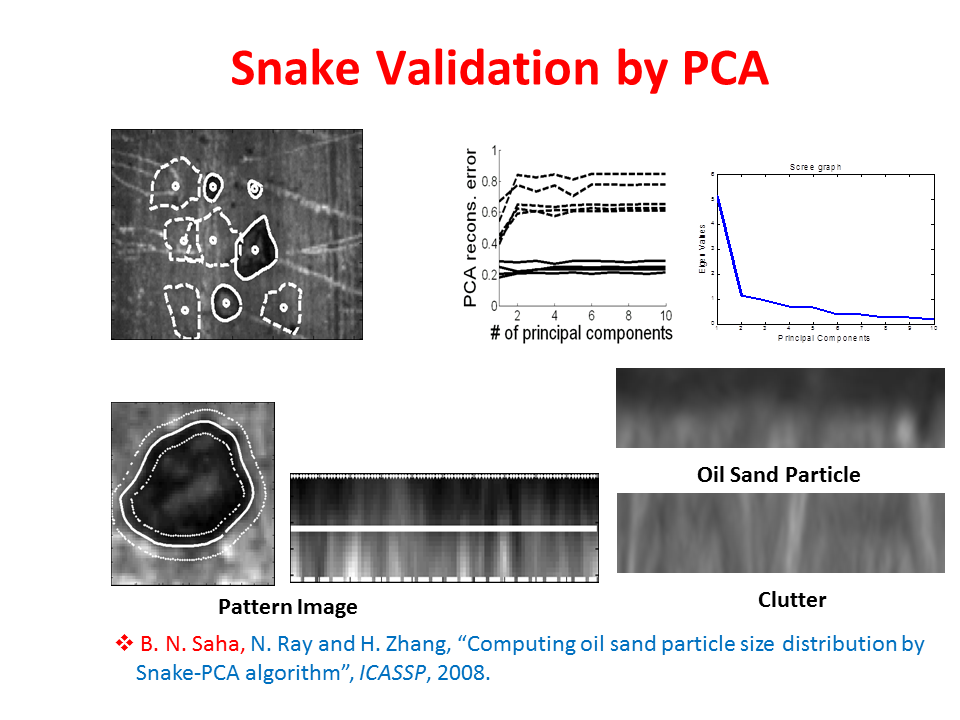
Snake Validation by PCA: When we evolve snakes from initial seed points, we construct a "pattern image" by taking an annular band acorss each object edge and then warped into a rectangular image for computational convenience. Pattern image carries intensity transitions across object edges which discriminate desired objects from clutter. We use pattern image for PCA classification. Pattern image associated with low PCA reconstruction error belong to desired object class as shown in Figure 13. For further details, please read our papers:
Quick detection of brain tumors and edemas: A bounding box method using left-right brain symmetry
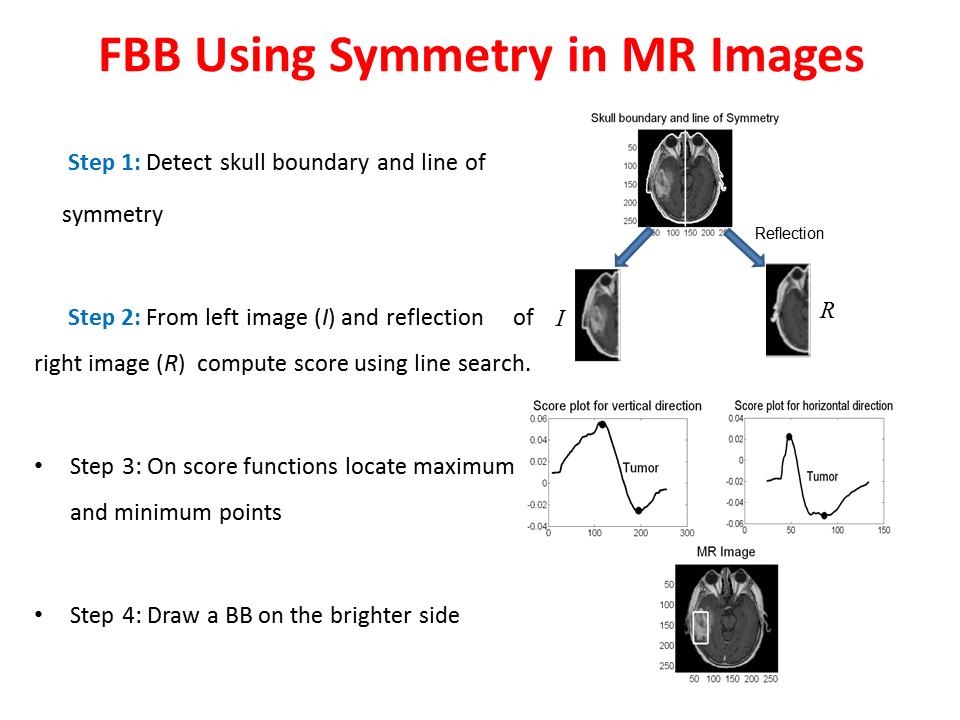
Abstract:A significant medical informatics task is indexing patient databases according to size, location, and other characteristics of brain tumors and edemas, possibly based on magnetic resonance (MR) imagery. This requires segmenting tumors and edemas within images from different MR modalities. To date, automated brain tumor or edema segmentation from MR modalities remains a challenging, computationally intensive task. In this paper, we propose a novel automated, fast, and approximate segmentation technique. The input is a patient study consisting of a set of MR slices, and its output is a subset of the slices that include axis-parallel boxes that circumscribe the tumors. Our approach is based on an unsupervised change detection method that searches for the most dissimilar region (axis-parallel bounding boxes) between the left and the right halves of a brain in an axial view MR slice. This change detection process uses a novel score function based on Bhattacharya coefficient computed with gray level intensity histograms. We prove that this score function admits a very fast (linear in image height and width) search to locate the bounding box.
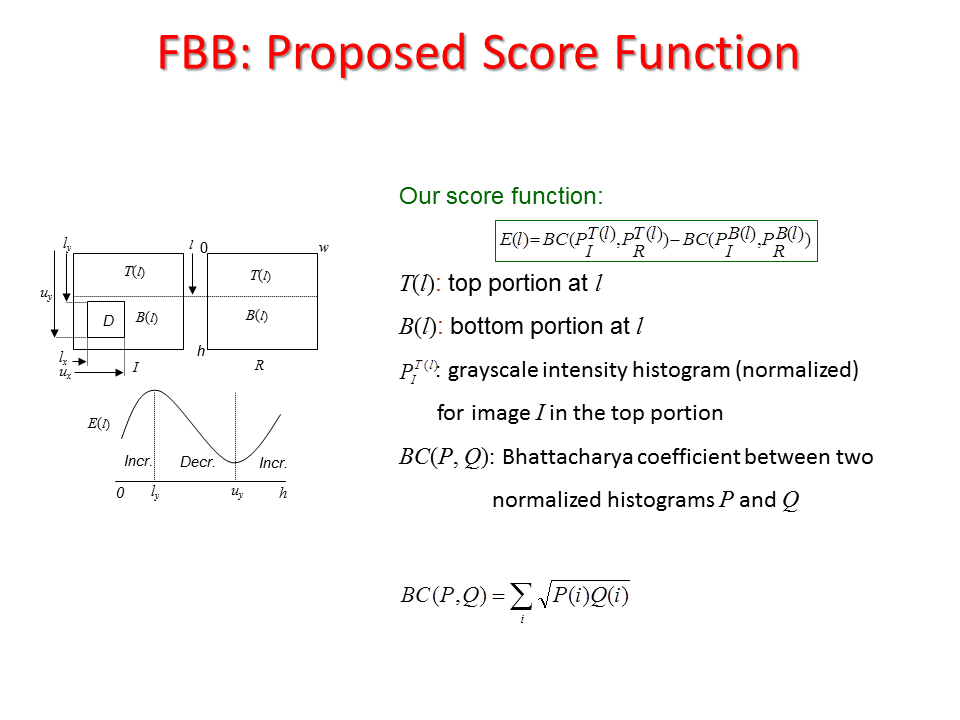
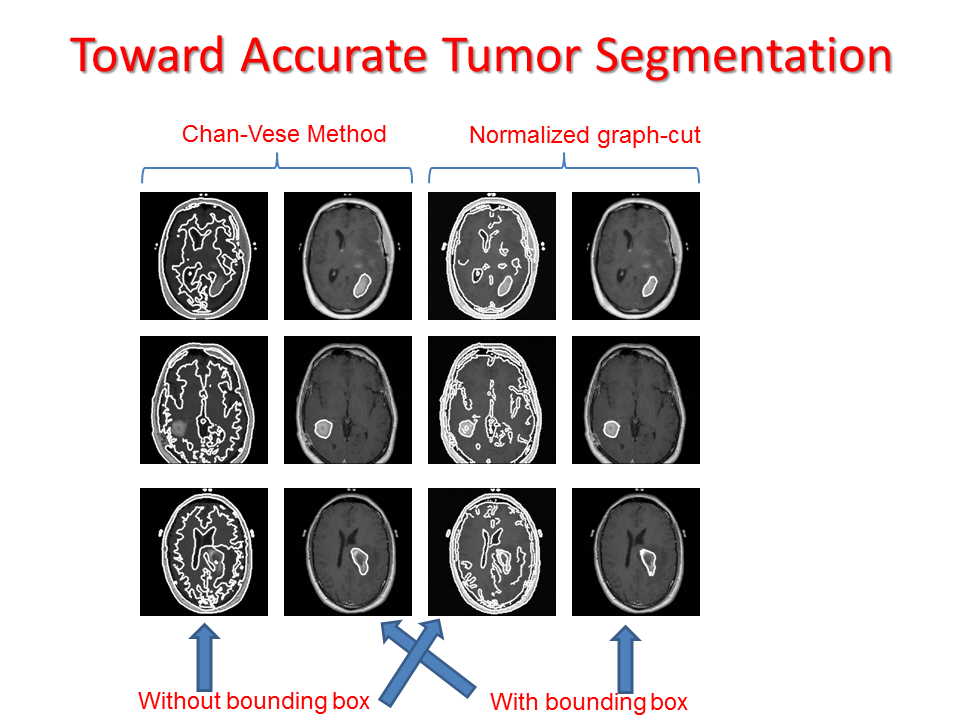
Proposed Method:We propose two sequential line search; one vertical and one horizontal and computes a score function based on Bhattacharya Coefficient (BC) at each line position as shown in Figure 14. The minimum and maximum value of the score function gives the end position of the anomaly as shown in Figure 14 and Figure 15. Accurate segmentation methods fail to segment brain tumor boundary successfully. However, these accurate segmentation methods such as Chan-Vese and Normalized graph cut method can successfully delineate tumor boundary if they are applied within the bounding box automatically found from the proposed "Fast Bounding Box" (FBB) as shown in Figure 16.